This map is a layout of the KGS Geologic Map Information Service which activates layers that display the locations of known landslides and areas susceptible to landslides in a geologic and geomorphic context. The purpose of the map is to provide an overall view of landslide hazards across the state. Locations come from Kentucky Geological Survey research, published maps, state and local government agencies, the public, and media reports, thus making attributes and spatial accuracy highly variable. There are five landslide data layers represented as either points, lines, or polygons. This map can be used to identify preexisting landslides and serve as a basis for landslide hazard and risk assessments. It is not intended for site specific investigations. The absence of landslides in an area does not infer that a landslide does not exist or that the ground is stable. A professional geologist or geotechnical engineer should be consulted for planned construction at identified landslide locations or identified landslide areas. A professional geologist or geotechnical engineer should also be consulted for slope stabilization and other mitigation efforts related to existing slides.
The default Base Layer shown is a LiDAR-derived multi-directional hillshade (1.5 m). The LiDAR layer (Layers menu - under the "KYFromAbove Layers" heading) can be adjusted for varying amounts of transparency and is particularly useful to view with the geology layers and/or the aerial photography Base Layer.
Landslide Map Layer Descriptions
Five datasets are contained within the "KGS Landslide Inventory" map layer. Their descriptions are as follows:
KGS landslide inventory data
This map layer contains known landslide locations (points) across Kentucky compiled in a landslide inventory database. The locations come from Kentucky Geological Survey research, state and local government agencies, and the public. The points represent larger landslide areas that have not been mapped in detail and may fall within different parts of the slide area (crown, head scarp, middle, or toe). The landslides are active or have historically been active. Landslide locations are collected at different times and contain varying amounts of attributes. Click on a landslide point in the map to view the attributes. Many attribute values are "Null" or �n/a� and data is only present if the slide was visited or could be collected another way.
The SourceDesc field describes the source of the landslide location. KGS=Kentucky Geological Survey, KY EM = Kentucky Emergency Management, KYTC = Kentucky Transportation Cabinet, DNR-DMRE = Division of Natural Resources-Mine Reclamation & Enforcement, NRCS = Natural Resource Conservation Service, NKAPC = Northern Kentucky Area Planning Commission, NKU = Northern Kentucky University. The inventory does not capture work by private industry or other agencies that document landslides but do not make them available.
KGS landslide inventory data: February 2025 storm event
These landslides were documented primarily through the social media accounts of the Kentucky Transportation Cabinet District Offices and Kentucky Emergency Management. A few locations were documented through traditional media sources and the public. The points represent larger landslide areas that have not been mapped in detail and may fall within different parts of the slide area (crown, head scarp, middle, or toe). Click on a landslide point in the map to view the attributes.
KGS landslide inventory data: July 2022 storm event
These landslides were documented by the KGS as a field reconnaissance effort following a series of storms that occurred between July 25 and July 30, 2022. We documented landslides from late August to early November 2022 using (1) visual field inspection methods and (2) a remote sensing technique called normalized differencing vegetation index (NDVI). Visual field inspection occurred primarily along roads through documentation of landslide type and location. Although there were certainly more, our allotted time allowed us to identify more than 1,000 new landslides and debris flows triggered by the July event. The majority of landslides identified were shallow translational slides, supplemented by some rotational slides (slumps), and debris flows. The points represent larger landslide areas that have not been mapped in detail and may fall within different parts of the slide area (crown, head scarp, middle, or toe). Click on a landslide point in the map to view the attributes.
1:24,000 geologic map landslides
These landslide locations (polygons) were mapped on 7.5-minute, 1:24,000-scale geologic quadrangles published jointly by the Kentucky Geological Survey and US Geological Survey from 1960 to 1978. Attributes include original map symbol, formation name, county, quadrangle, and Area Development District. Landslides were not mapped on all quadrangles in Kentucky. Search source data on the KGS publications search page.
Derived from LiDAR
These landslides (polygons) were interpreted and mapped using LiDAR-derived digital elevation models (DEM) that range from 1 to 1.5-meter horizontal resolution and have a quality level of 1 to 3. The quality level refers to nominal pulse spacing (NPS), which is an aggregate of all strikes and is approximately < 0.35 to < 1.4 m). Ground strike spacing, which is what is used to generate bare earth hillshade models, will typically be greater that the aggregate NPS. Primarily using LiDAR-derived hillshades, landslide extents were identified and digitized. Extents of landslides were digitized to include features such as headscarps, flanks, toe slopes, and hummocky topography observed in the hillshade. Secondary support maps including slope, roughness, curvature, plan curvature, and contours, as well as aerial photography, were used to help identify landslide features and constrain confidence in interpreting landslide extents. Locations were field verified, where possible. Attributes vary depending on when landslides were mapped. Some of the mapped landslides have a specific mapper-based confidence rating system. For those values see these resources:
Derived from Aerial Photos
This layer (polygons) represents mapped landslides including earthflows, debris slides, and slumps. The data come from a series of published Landslide and Related Features Maps and Landslide Potential Maps that cover most of southeastern and south-central Kentucky. Landslides were interpreted from aerial photographs and historical records. The features digitized (polygons) depict generalized slope conditions as they existed at the time of field checking (1977-1981). Slope stability may decrease by excavation, loading, and changes in drainage conditions. The data are from preliminary type maps and are suited for general planning purposes only. Search source data on the KGS publications search page.
Areas susceptible to debris flows
This layer (lines) represents debris flow deposits or areas susceptible to debris flows. Primarily these areas are shallow, narrow ravines containing variable accumulations of hillslope soil called colluvium. Areas of thick colluvium are susceptible to rapid movement during intense rainfall. The data come from a series of published Landslide and Related Features Maps and Landslide Potential Maps that cover most of southeastern and south-central Kentucky. The features were interpreted from aerial photographs and historical records. The debris flows digitized (lines) depict generalized slope conditions as they existed at the time of field checking (1977-1981). The data are from preliminary type maps and are suited for general planning purposes only. Search source data on the KGS publications search page.
KGS Landslide Inventory Data Dictionary � Attribute Information
This table serves as a reference for attributes in the layer KGS landslide inventory data, attributes for all other layers vary.
Field Name
Description
Data Type
Acceptable Values
Notes
ID
Unique numeric identifier of the feature
Double
SourceDesc
Data source contributing to the feature
Text
KY EM, KGS, NKU, NRCS, KYTC, AML, NKAPC, DNR-DMRE, Media alert, Public, or Other
Location of the feature in relation to notable natural or anthropogenic features
Text
above and below road; above road; above road, stream at bottom; artificial fill slope; below road; below road, stream at bottom; bridge embankment; general road embankment; mine highwall; natural cut slope (stream); natural slope; road cut
Slope_Angle
Angle of the slope at location of feature
Double
The points represent larger landslide areas that have not been mapped in detail and may fall within different parts of the slide area (crown, head scarp, middle, or toe). The slope angle is taken from this point.
Aspect
Cardinal direction in which the location of the feature is oriented
Indicates presence of fractures at feature location
Text
Y, N
Faults
Indicates presence of faults at feature location
Text
Y, N
Water_Present
Description of amount of water present at feature location
Text
dry, moist, very wet, wet
Contributing_Factor
Description of any potential contributors to feature occurrence
Text
blocked drainage structures, flooding (rapid drawdown), high infiltration rates - seepage, oversteepening of slope, ponded water, removal of toe (erosion), removal of toe (excavation), saturated ground, subsurface drainage, surface drainage, weathering of clay-like shale, failure of retaining wall, failure of driven piles, failure of drilled-in piles
Indicates if the feature represents a new slide or a pre-existing slide
Text
new, existing
Cost
Necessary estimated US dollar value to repair feature damages
Double
near_milepoint
Mile marker most proximal to feature
Double
begin_mp
The first mile point in the range if landslide location is provided as a range
Text
end_mp
The last mile point in the range if landslide location is provided as a range
Text
Confidence Ranking
A semi-quantitative confidence ranking is assigned to each landslide feature for all layers shown on the map. The rankings are based on Landslides Across the USA: Occurrence, Susceptibility, and Data Limitations (Mirus and others, 2020). Confidence rankings range from �1� (low confidence) through �8� (high confidence) and reflect the relative value of different data.
8 � High confidence that the nature and/or spatial extent of the landslide is well characterized
This highest confidence level is typically based on detailed field observations and/or expert
analysis of high-resolution topographic data or aerial imagery to characterize the landslide.
5 � Confident that a consequential landslide took place at the specified location
This level of characterization still involves high confidence that a landslide took place at
the specified location as evidenced by fatalities and/or damage to infrastructure, but
detailed observations of landslide features are not described in the geodatabase.
3 - Landslide likely at or near the specified location
This middle confidence level reflects a known landslide occurred with lower certainty on
the exact position or nature of the slope failure. These typically include verified landslides
on lower resolution topographic maps or aerial imagery and landslide data that predates
digital topography and precise global positioning systems
2 - Probable landslide in the area
Although the exact location and extent of the landslide is not documented, it is probable
that a landslide did occur within close proximity to the specified location. This includes
geologic mapping of landslide deposits that may correspond to multiple landslides as well
as individual landslides mapped with low resolution topographic data.
1 - Possible landslide occurred in the area
The lowest confidence level reflects the uncertain nature of some media reports and the
lack of expert classification and characterization from old maps.
Landslide Susceptibility
A landslide susceptibility map classifies or ranks slope stability based on relationships between variables that contribute to instability. This method differs from other types of landslide hazard maps, which may include elements of time or estimated landslide extent. Learn more about this layer.
Landslide Basics
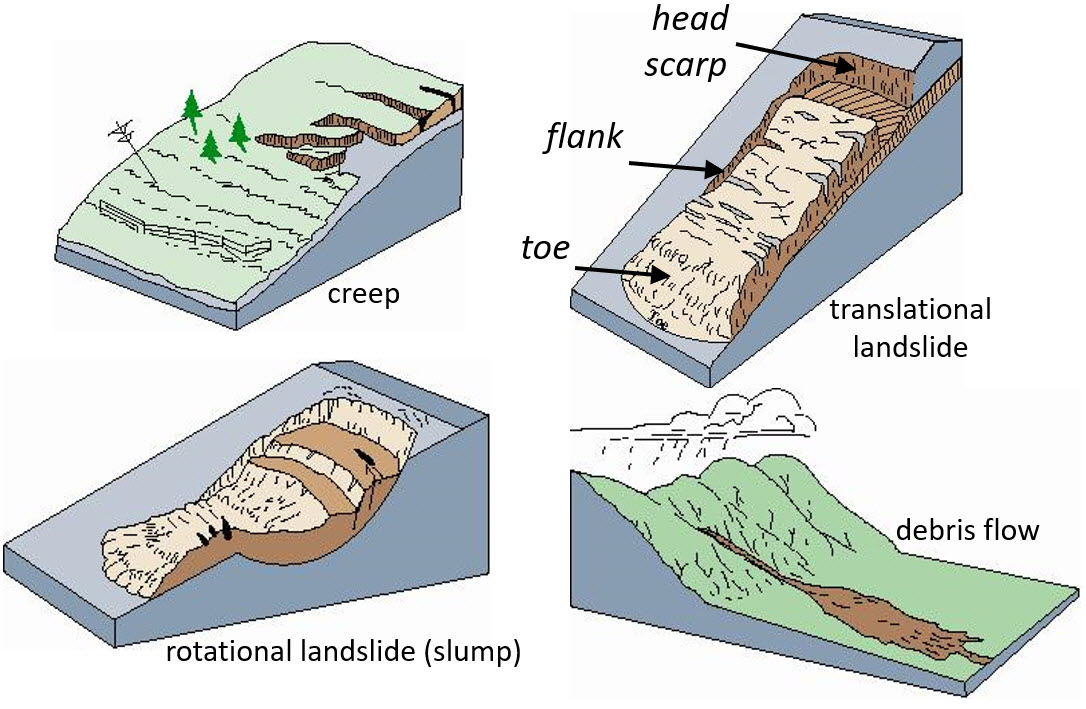
Landslides are the downslope movement of rock, soil, or both under the influence of gravity. A combination of steep slopes, excessive pore-water pressure, weak rocks and soil, and slope modification commonly contributes to landslide occurrence. Landslides types vary by the rate of movement, style of movement, and type of hillslope material involved (Figure 1). Figure 1. Selected landslide types commonly occuring in Kentucky. Modified from The Landslide Handbook, U.S. Geological Survey Circular 1325 (2008).
Landslides are caused by stresses on a slope that exceed the strength of the hillslope soil. Stresses can include increased pore-water pressure (from rainfall), gravity, or some type of slope modification (loading or excavating). Intense or long-duration rainfall can trigger slides, rock falls, debris flows, or other landslide types. The danger is greatest during the late winter and early spring months, before large trees leaf out and remove water by evapotranspiration as it infiltrates into hillside soils. These stresses act over time and space at different scales and magnitudes, often making hazard and risk assessment challenging. Diverse terminology and definitions among geologists, engineers, and the public are a reflection of the complex landslide processes. Some of the most common terms are landslide, mudslide, and rockslide. Other terms such as mass wasting, slope movement, and slope failure are also commonly used to discuss landslide phenomena. Regardless of which term is used, all landslides share physical and mechanical (in rock and soil) processes that explain their occurrence.
 KGS landslide inventory data: July 2022 storm event